Weather analysis reduces uncertainty — it does not eliminate it. The goal is to quantify your exposure accurately, not to predict what next year's weather will be.
The Atlanta metro is one of the largest and fastest-growing construction markets in the United States. Billions in annual commercial volume, a residential market that hasn't stopped since the early 2010s, and a pipeline of data center, industrial, and infrastructure work that shows no sign of slowing. It's also a market with a weather risk profile that catches outside contractors off guard in ways that don't show up in the forecast until the damage is already done.
The problem isn't dramatic weather. Georgia doesn't have Texas's hurricane exposure or the Great Plains' tornado counts. The problem is the soil. Georgia's famous red clay — the same iron-rich substrate that covers most of the Piedmont and upper coastal plain — behaves differently from almost every other soil type in the country when it gets wet. It absorbs moisture slowly, releases it even more slowly, and creates an earthwork recovery window that can turn a routine week of spring rain into three weeks of unworkable site conditions. Contractors who price Georgia work using the same assumptions they'd apply to sandy southern soils or northern loam consistently underestimate the earthwork exposure.
Layer heat, afternoon thunderstorms, spring severe weather, and Gulf moisture over that clay foundation, and Georgia becomes one of the harder states to budget accurately in the Southeast.
- Georgia red clay creates earthwork recovery times 2–3× longer than sandy soils — a 3-day rain event can take 7–10 days before the site is fully productive again
- Spring thunderstorm season (March–May) combines high rainfall frequency with tornado risk, making it the most complex weather window on most Georgia projects
- Summer heat index regularly exceeds 105°F in Atlanta, triggering real productivity loss on heavy outdoor work well before a formal shutdown threshold is reached
- Gulf moisture systems in late summer can produce 5–8 inch rainfall events with little warning — not hurricane landfalls, just moisture transport
- P80 earthwork exposure on a clay site in the Georgia Piedmont is typically double what a simple rain-day count suggests
The Four Weather Risks That Drive Georgia Construction Exposure
The Clay Problem: Why Georgia Earthwork Is Uniquely Expensive
Most estimators understand that Georgia has red clay. Fewer understand what that actually means for earthwork productivity modeling.
Georgia's Piedmont clay — the dominant soil type covering the metro Atlanta area, north Georgia, and most of the state west of the fall line — is a highly plastic, low-permeability material. When it absorbs water, it swells. When it dries, it shrinks and cracks. The moisture window within which it can be productively graded, compacted, and tested is narrower than almost any soil type in the country.
That moisture window is also slow to re-establish after a rain event. A sandy or gravelly site might be productive within 24 hours of rain stopping. A Georgia clay site after a significant event is a different calculation entirely.
Georgia Piedmont clay represents the worst-case soil drainage profile commonly encountered in the Southeast. Recovery times assume a moderate 3-day event (1.5–2.5" total). Consecutive rain events with insufficient dry time between them compound recovery lag significantly.
A week of spring rain in Atlanta doesn't cost an earthwork crew one week. On red clay, with a proper compaction spec, it costs three.
The multiplier effect is the key insight. Standard weather contingency models price rain days as a one-to-one loss: one non-workable day per rain day. On Georgia clay, the ratio is closer to 2.5 to 3.5 — for every rain day in the spring season, the effective productivity loss in the earthwork schedule is two to three calendar days once recovery lag is factored in.
This is not a theoretical adjustment. It's the consistent real-world outcome that contractors with Georgia clay experience report — and the gap between what the estimate assumed and what the project delivered.
Spring Severe Weather: The Window Most Estimates Undercount
March through May is Georgia's most complex weather window — and the one most frequently underweighted in project estimates. This is when spring severe thunderstorm activity peaks, tornado risk is highest, and rainfall frequency is greatest, all at the same time that most projects are breaking ground and beginning earthwork.
The combination creates compounding risk. A severe thunderstorm cell that produces 1.5 inches of rain and a tornado warning doesn't just cost the afternoon. On a clay site, it starts a 7–10 day recovery clock. If a second storm system follows three days later — common in spring Georgia — the clay never fully dries between events, and recovery lag stacks.
Illustrative P50 estimates for Atlanta-area earthwork on Piedmont clay soil. April and May reflect both high rainfall frequency and clay recovery lag. October and November represent Georgia's best earthwork window by a meaningful margin.
For projects breaking ground in late winter or early spring — a common schedule pattern driven by permit timing — the April and May earthwork window should be treated as a constrained resource, not a normal productivity assumption. Scheduling major earthwork milestones to depend on April completion dates in Atlanta, on clay soil, is one of the more reliable ways to miss a schedule.
Summer Heat: Where Georgia's Productivity Loss Is Invisible
Georgia's summer heat is real, but it operates differently from the desert heat of west Texas or Arizona. The mechanism in Atlanta isn't extreme air temperature — it's the combination of 90–96°F temperatures with humidity levels that push heat index values well above what the thermometer shows. A 93°F day with 70% relative humidity produces a heat index of 107°F, which puts outdoor workers in OSHA's "High" risk category regardless of what the raw temperature reading suggests.
Atlanta averages 40+ days per year with heat index above 103°F during summer months. Productivity loss in the 103–115°F band is where most Georgia summer labor budgets are underestimated — these days don't register as shutdowns, but they generate 30–40% less output than the schedule assumes.
The practical impact is that Georgia earthwork and site work running June through September operates at significantly reduced output on many days without ever generating a formal weather shutdown event. Concrete pours get pushed to predawn starts. Crew productivity on heavy digging and compaction work drops as the morning progresses. Hydration and rest break requirements build in the schedule inefficiency that never shows up as a weather day.
Xyloclime Pro models heat index productivity impact as a separate factor from workable-day counts, which is the only way to price it accurately. Pooling heat productivity loss with rain shutdown days produces a number that's analytically wrong for both — and usually underprices the summer heat exposure on Georgia scopes while slightly overpricing the summer rain exposure.
Georgia Seasonal Risk Calendar
| Month | 🌧 Rain / Clay | ⛈ Severe Wx | 🌡 Heat | 🌀 Gulf Moisture | Overall |
|---|---|---|---|---|---|
| January | Low | Low | — | — | Low — favorable conditions |
| February | Low | Low | — | — | Low — best winter window |
| March | Med | Med | — | — | Moderate — severe season opens |
| April | Peak | High | — | — | Peak — clay lag + storms |
| May | High | High | Low | — | High — busiest severe weather month |
| June | Med | Med | Med | Low | Moderate — afternoon storms + heat |
| July | Med | Low | High | Med | High — peak heat exposure |
| August | Med | Low | High | High | High — heat + Gulf moisture events |
| September | Med | Low | Med | High | Moderate — Gulf tail exposure |
| October | Low | Low | — | — | Low — best building window |
| November | Low | Low | — | — | Low — excellent conditions |
| December | Low | Low | — | — | Low — mild winter |
Risk levels are statewide composites. Coastal Georgia (Savannah, Brunswick) has higher tropical and moisture exposure. North Georgia mountains have a more compressed winter building season. The April peak reflects both high rain frequency and clay recovery lag compounding — individual risk factors are moderate, but the combination produces the most restricted workable-day window of the year.
Building a Georgia Weather Budget That Holds
-
Separate earthwork weather risk from the rest of the project Georgia clay earthwork carries materially higher weather exposure than every other phase on the same project. Blending it into a single project-wide contingency understates the earthwork exposure while wasting contingency on structural and interior phases that are far less sensitive. Run earthwork weather analysis independently, sized to the activity-specific soil conditions and project-window rainfall distribution.
-
Apply a clay recovery multiplier to spring rain events For earthwork on Piedmont clay soil running March through June, each multi-day rain event generates substantially more than one non-workable day. A reasonable starting point: multiply the expected non-workable day count for the spring window by 2.0 to 2.5× to account for recovery lag. Refine based on site-specific drainage conditions and the compaction specification's moisture window requirements.
-
Avoid scheduling earthwork completion milestones in April and May Based on historical workable-day distributions, April and May represent Georgia's worst earthwork productivity window — not because of catastrophic events, but because of the sustained combination of high rain frequency and slow clay recovery. If the schedule requires earthwork completion before summer, back-calculate from the target date using realistic April/May productivity rates, not calendar-day assumptions.
-
Price summer heat as a productivity factor, not a shutdown day count Atlanta's summer heat creates 30–40% labor productivity loss on heavy outdoor work without generating formal shutdown events. This needs to be modeled as a labor efficiency factor in the earthwork and site work cost build — not as additional calendar days, which is the wrong mechanism for a productivity effect rather than a binary stop.
-
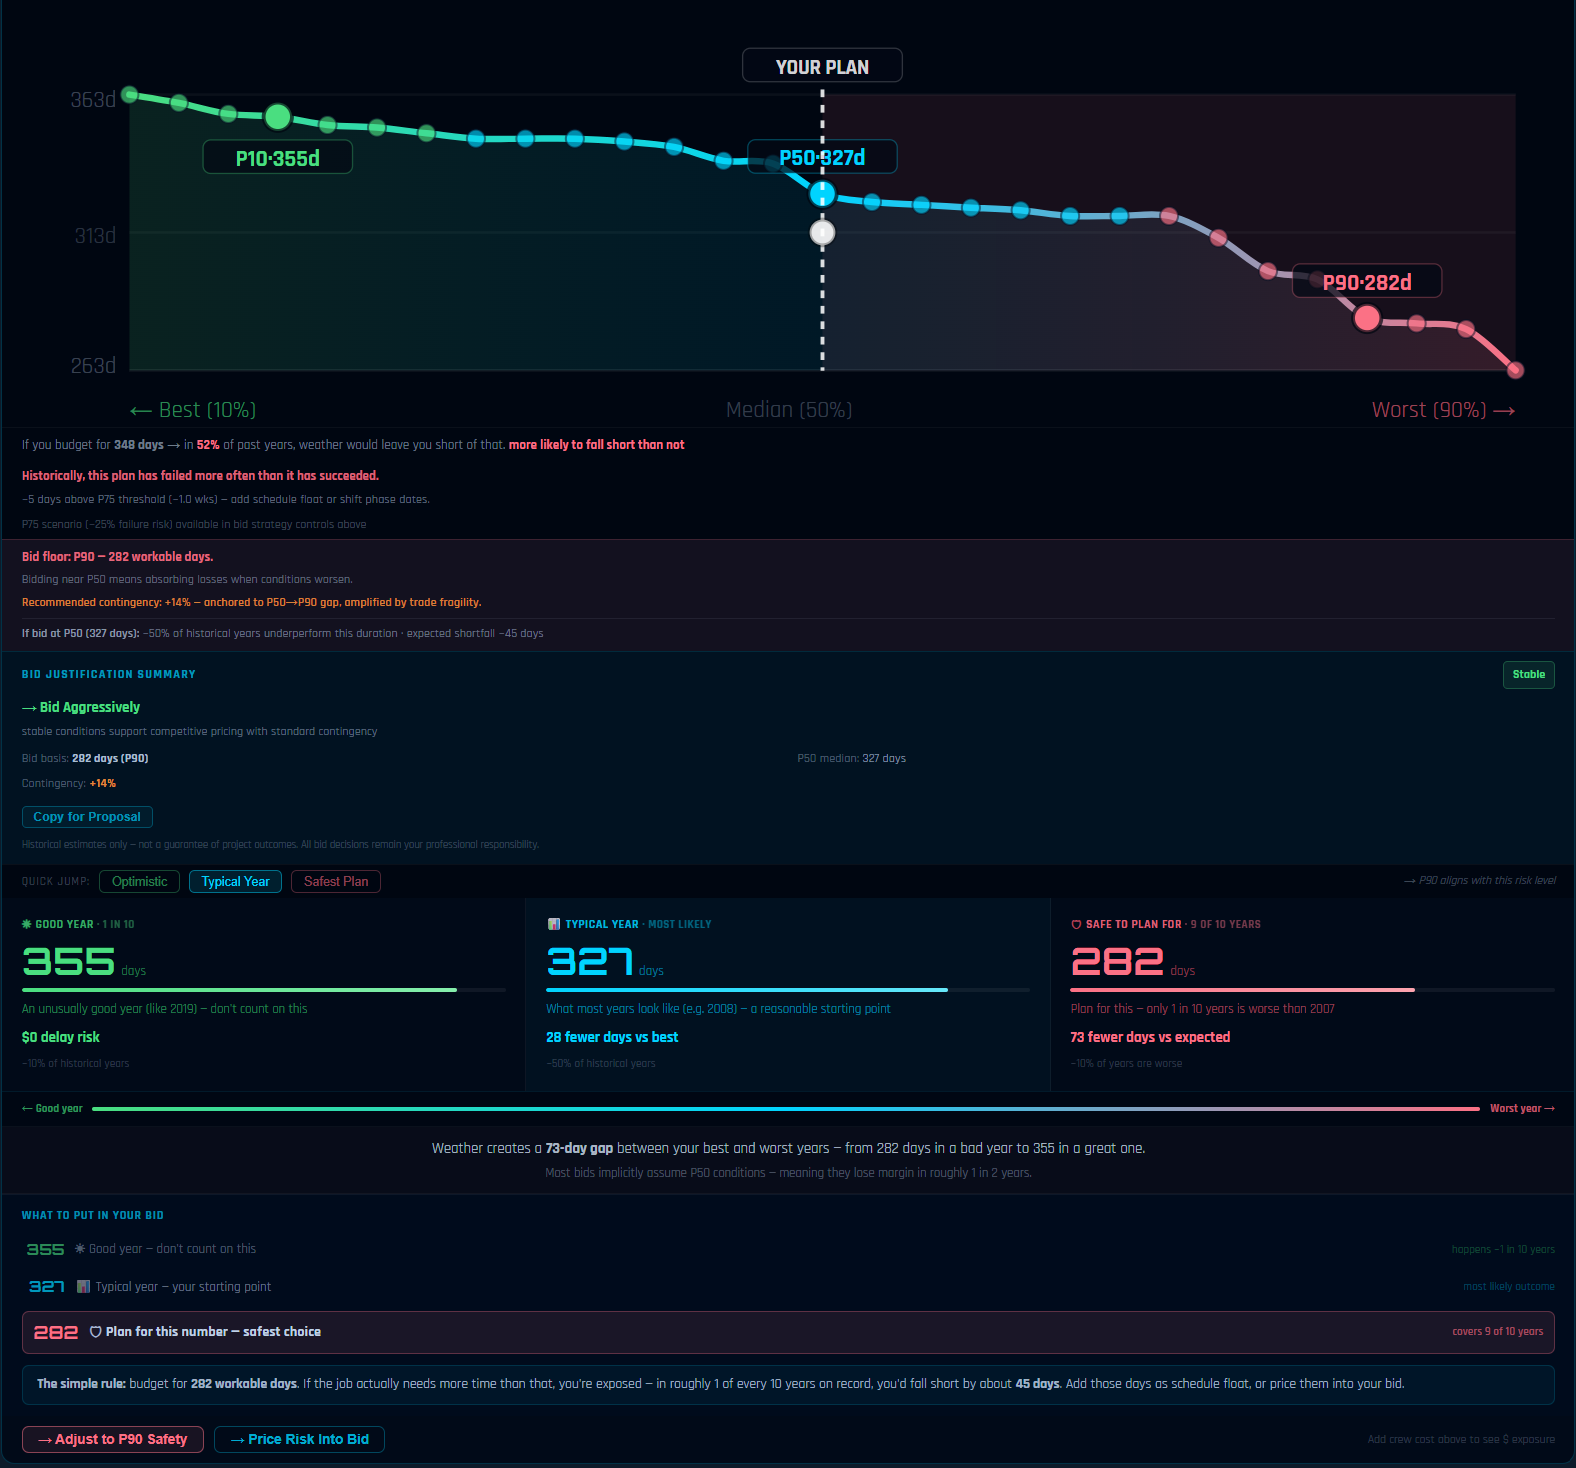
Run P50 and P80 scenarios and show the owner the difference Georgia weather variance is high enough that the gap between a typical year (P50) and a moderately bad year (P80) is significant. P50 is the base case. P80 is the risk story. Presenting both allows for a defensible contingency conversation grounded in historical frequency rather than a round-number markup that neither party can justify.
A 150-day site work and underground utilities scope in the Atlanta metro, running March through July on Piedmont clay soil. Simple 30-year rain-day average: 22 non-workable days.
Recency-weighted P50 with clay recovery multiplier applied: 38 non-workable days — reflecting the April/May clay lag and recent upward trend in spring rainfall frequency in the Atlanta market.
Recency-weighted P80 with clay recovery: 54 non-workable days — modeling a wet April followed by a late-spring Gulf moisture event in early June that saturates the site before summer drying begins.
Gap between simple average (22 days) and P80 estimate (54 days): 32 additional days of exposure. At a typical earthwork and site work daily cost of $14,000–$18,000, that's $448,000–$576,000 in unpriced exposure on a single spring scope — from a moderately bad year in a market most contractors consider mild.
The Bottom Line for Georgia Estimators
Georgia is an excellent state to build in the right windows — October and November offer some of the most productive construction conditions in the Southeast, and the mild winter allows work to continue through December and January on most activities. The problem is concentrated in a 10-week window each spring and a 12-week window each summer, and it isn't about dramatic storms. It's about red clay multiplying the cost of routine rainfall by a factor that most estimates never account for.
Contractors who price Georgia work with out-of-state intuitions about southern weather — mild, a few summer thunderstorms, nothing like the north — consistently find themselves with earthwork schedules that don't hold and contingencies that run out in April. Contractors who understand the clay, model the recovery lag, and treat the spring window as a constrained resource find themselves with estimates that reflect reality and contingencies they can defend to owners with data rather than gut feel.
Stop Guessing on Georgia Clay — Start With the Data
P50 and P80 earthwork analysis — clay recovery lag includedXyloclime Pro models 30 years of NOAA and ERA5 weather data for any Georgia project location, applies recency weighting, and outputs phase-specific workable-day scenarios that account for soil recovery dynamics — so your Georgia earthwork budget reflects what actually happens on Piedmont clay, not what happens on sandy coastal soil.
Start Free 7-Day TrialNo charge for 7 days. Cancel anytime before day 8.