Every estimator knows weather is a risk. Few know exactly how much to charge for it.
The result is a gap that quietly kills margins. You add a contingency — 5%, maybe 10% — based on gut feel or last year's bad run, and hope it's enough. Sometimes it is. Sometimes you're eating two weeks of idle equipment because January was wetter than anyone planned for.
There's a better way to price weather risk, and it starts with treating it like any other quantity: measure it before you bid.
Why Weather Contingencies Are Usually Wrong
Most weather contingencies fall into one of two traps:
Too low. The estimator remembers a few good summers, assumes average conditions, and adds 3%. The project runs through a wet spring and the number gets wiped out by week six.
Too high. The estimator remembers the bad year, adds 15%, and loses the bid to someone with a shorter memory. Correct risk assessment, wrong outcome.
Weather risk isn't a single number. It's a range with a shape — and that shape is different for every location, every season, and every type of work.
The core problem is that gut feel calibrates to memorable events — outlier years, the job that went sideways — not to actual historical distributions. Measuring from memory systematically overweights the extreme and underweights the typical.
What Historical Data Actually Tells You
NOAA maintains decades of weather station records for thousands of U.S. locations. Xyloclime Pro combines these NOAA station observations with ERA5 reanalysis datasets to improve coverage consistency across project locations — bridging gaps where ground station density is low and cross-validating readings against gridded reanalysis data.
When you pull that data for a specific site and project window, a few things become visible that gut feel never can:
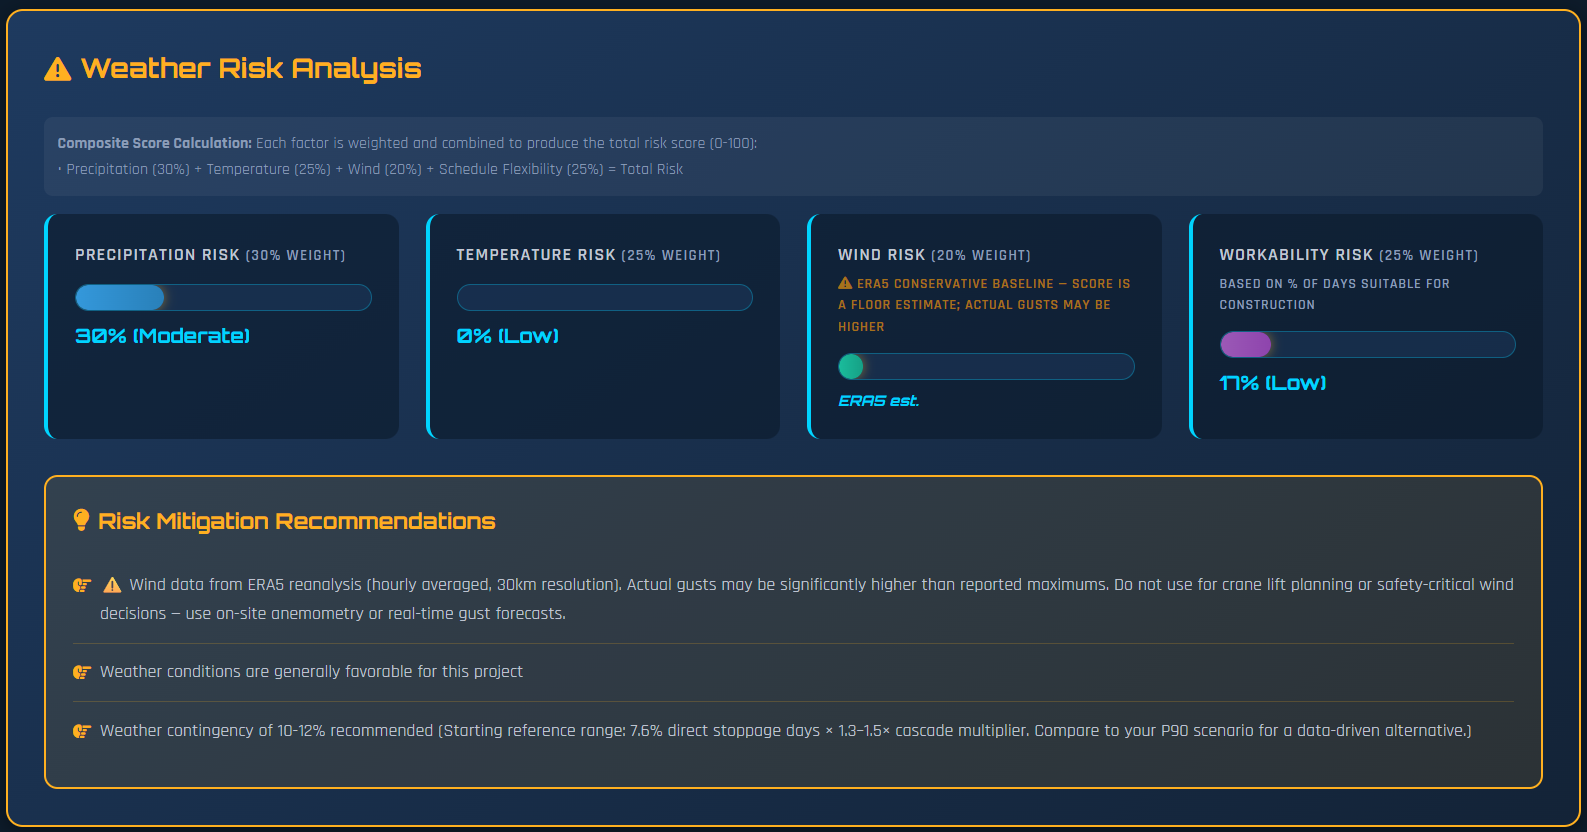
Workable days by month and activity
How many days in a typical October at your project location are actually workable for earthwork? For concrete pours? For structural steel? The answer varies by activity — a day that's fine for framing might be a no-go for a slab. Workable-day counts need to reflect activity-specific thresholds, not a one-size-fits-all stop/go rule.
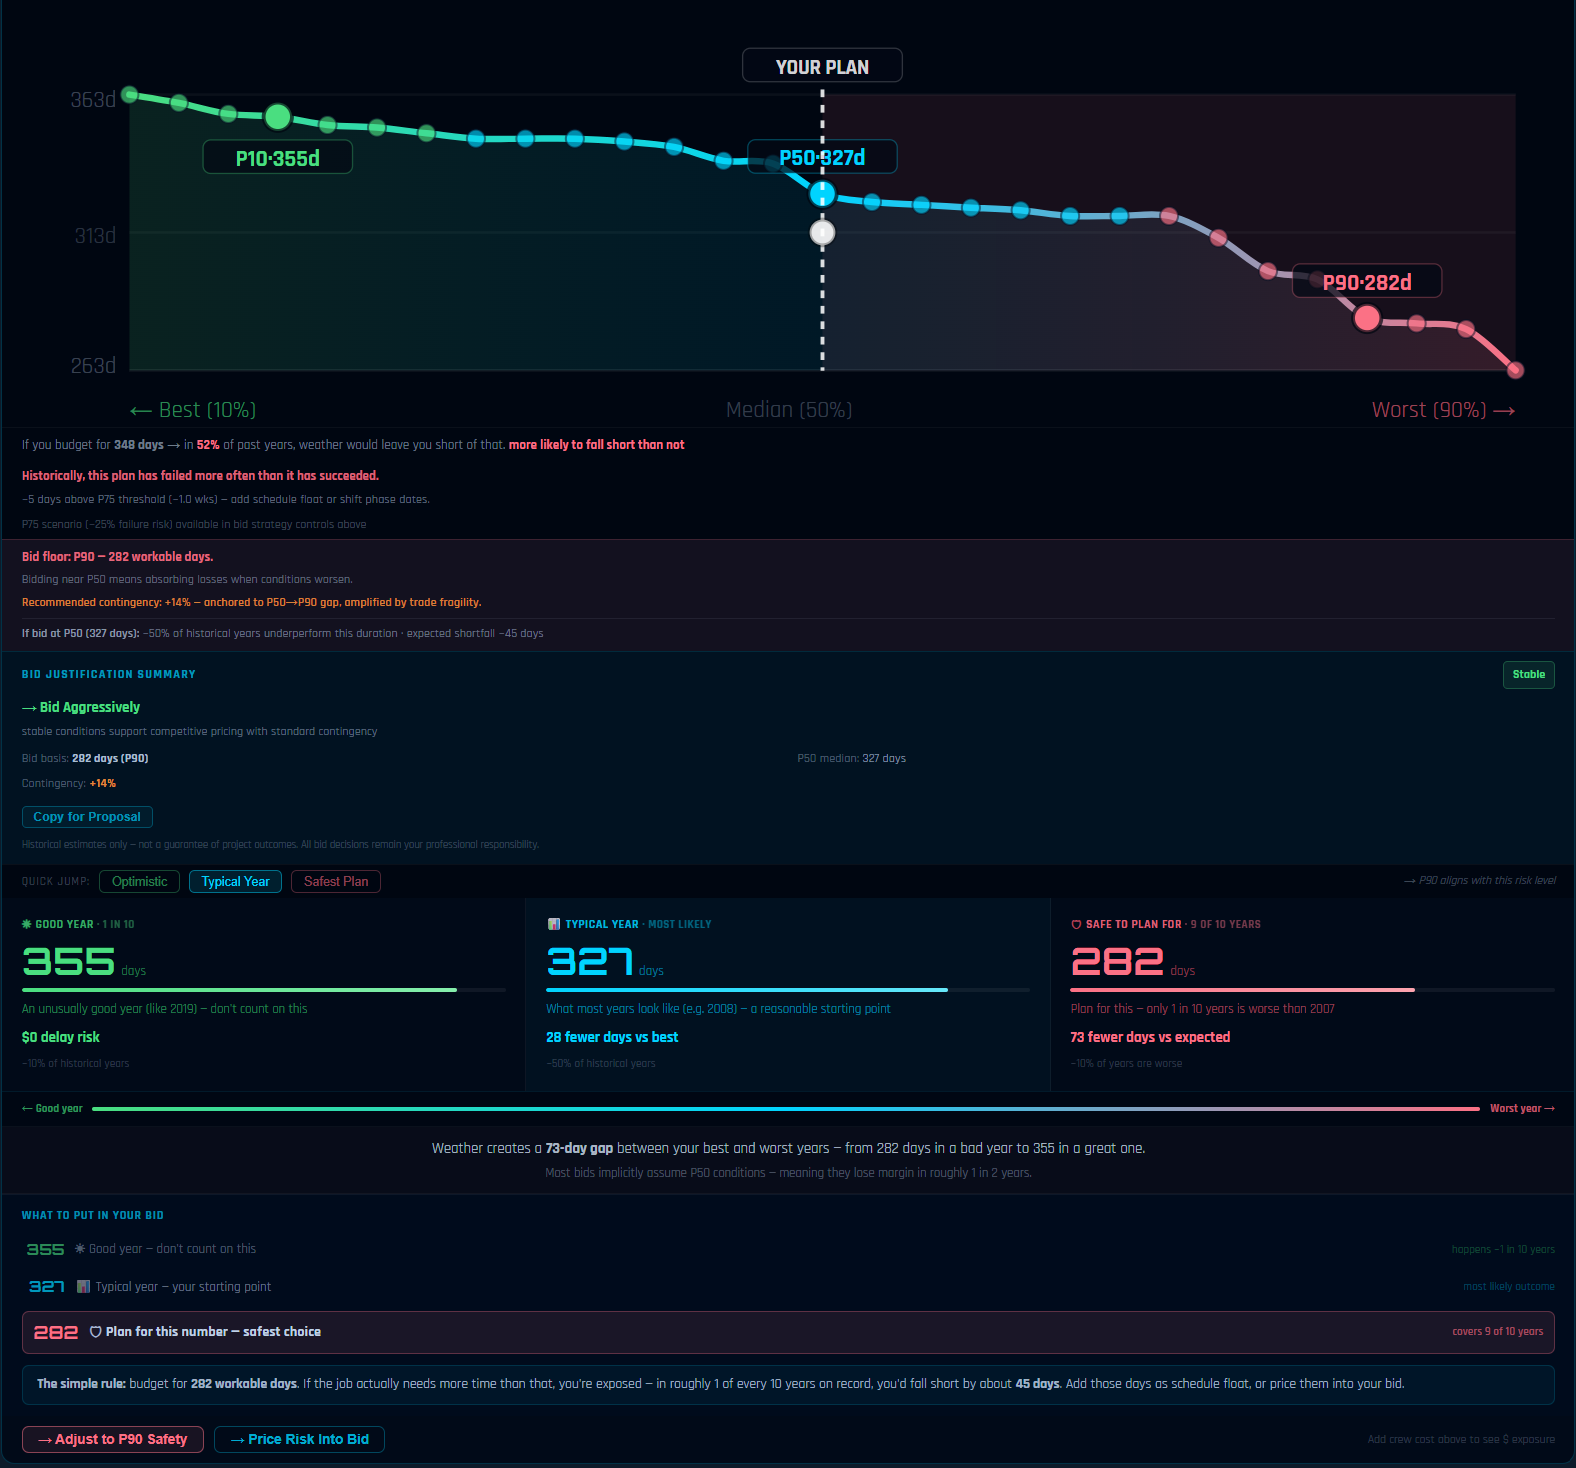
P10 / P50 / P90 scenarios
These percentiles describe the distribution of historical outcomes for a given location and time window. P50 is the median — conditions you'd expect in a typical year. P80 represents conditions worse than 80% of historical years — roughly a one-in-five-years scenario. P90 captures near-worst-case conditions. The gap between P50 and P80 is your real contingency range; the P90 tells you what a bad-weather year actually costs.
Year-to-year variance
Some locations have predictable weather. Others swing significantly — the average year looks manageable but one-in-three years the numbers are materially worse. That variance is your real exposure, and it only shows up when you look at 20 or 30 years of data rather than a recent average.
Compound weather sequences
Rain days and freeze days aren't independent events you can simply add together. A wet week followed by a hard freeze can extend earthwork recovery time far beyond what either event would cause alone, particularly during freeze-thaw transitions. Compound weather sequences can materially affect how long it takes to get back to productive work — especially for earth-intensive scopes with long recovery curves.
The Recency Problem — and How to Address It
Here's a subtlety most estimators don't account for even when they do pull historical data: a rainy day in 2005 should not carry the same weight as a rainy day in 2023.
Climate patterns shift. Seasonal baselines drift. The last five years of data are generally more predictive of next year's conditions than data from fifteen years ago — and your model should reflect that.
One practical approach is exponential recency weighting, where each historical year is assigned a weight that decreases with distance from the present. Xyloclime Pro uses a configurable decay factor to emphasize recent climate behavior while still preserving long-term historical context. Here's what the weight distribution looks like across a 30-year dataset:
Each historical year receives a weight based on how far back it sits. More recent years count more; older years still contribute but at reduced weight.
| Years Ago | Relative Weight | Weight Bar |
|---|---|---|
| Current year | 100% | |
| 5 years ago | 47% | |
| 10 years ago | 22% | |
| 15 years ago | 10% | |
| 20 years ago | 5% |
A simple arithmetic average of 30 years of NOAA data treats a wet season from 2000 the same as a wet season from 2024. Recency weighting corrects for that — producing a baseline that better reflects current climate behavior rather than long-term historical averages that may no longer be representative.
What This Looks Like in Practice
Consider a 180-day sitework and rough grading package in the Dallas–Fort Worth area, running October through the following March. An estimator using a simple 30-year average might budget 22 non-workable days for the earthwork window based on historical rain and freeze averages.
Simple 30-year average approach: 22 non-workable days budgeted for earthwork window
Recency-weighted P50 analysis (same location, same window): 28 non-workable days
Recency-weighted P80 analysis: 36 non-workable days
The recency-weighted P80 identified 14 additional non-workable days that the simple average missed — concentrated in the December–February freeze-thaw window, where recent years have shown higher volatility than the long-term mean.
At a typical earthwork crew cost of $18,000–$22,000 per day, that gap represents $250,000–$300,000 in unpriced exposure.
That's not a margin of error — it's a structural gap between what the estimate assumed and what historical data, properly weighted, actually shows.
A Framework for Weather-Adjusted Bidding
-
Define your weather-sensitive activities Not every line item is equally exposed. Earthwork, concrete, and exterior envelope work carry most of the risk. Interior work is largely weather-neutral. Identify which phases drive exposure before modeling anything.
-
Pull historical data for the specific project window Not annual averages — the actual months your schedule occupies, at the actual location. A project running October through March in central Pennsylvania has a completely different risk profile than one running April through September.
-
Apply recency weighting to the historical data A simple 30-year average without weighting may understate exposure in locations where recent seasons have trended wetter, hotter, or more volatile than the long-term mean.
-
Evaluate P50 and P80 scenarios Many contractors find it useful to evaluate both P50 and P80 scenarios when determining contingency and schedule strategy. P50 anchors the base case; P80 frames the contingency needed to absorb a moderately bad weather year. The delta between them is the number worth defending to an owner.
-
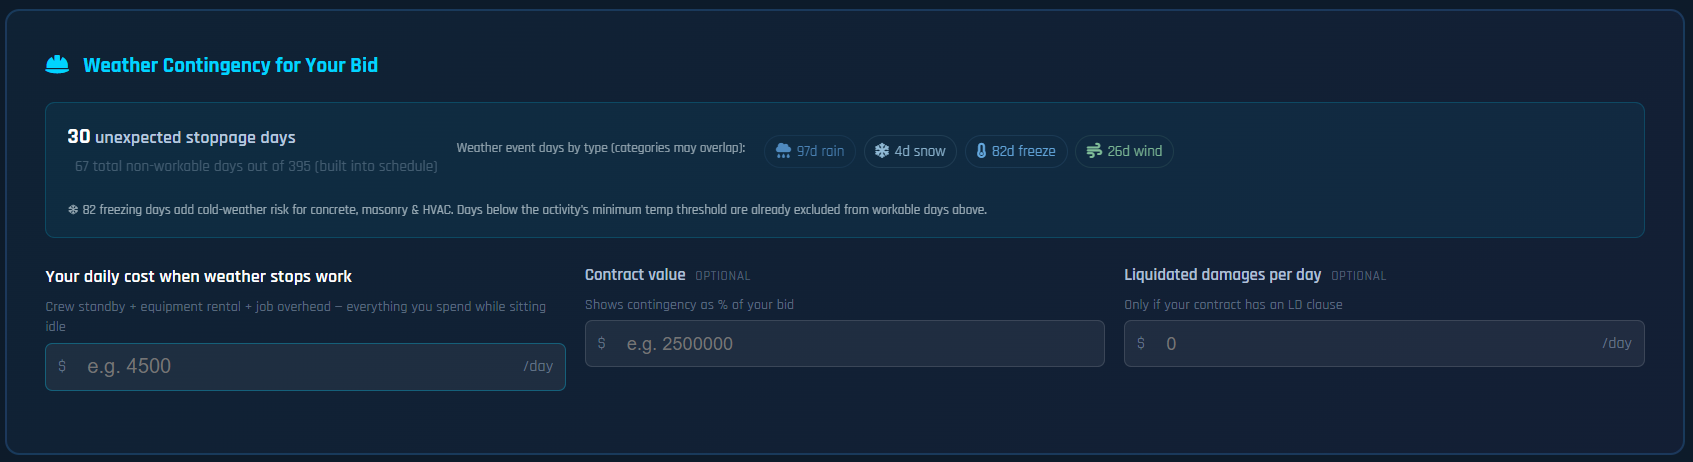
Separate shutdown events from productivity friction Full stop days — freezes, heavy rain, high wind above threshold — are quantifiable and should be scheduled as explicit float. Productivity loss from marginal conditions (working in light rain, cold mornings, muddy sites) is a separate category that affects output without stopping the job. Both need to be in the number.
Where Estimators Leave Money on the Table
Two patterns come up consistently when weather risk isn't quantified properly:
Underpriced schedules. The bid wins, but the schedule was built on P50 assumptions. When the project hits a P75 or P80 weather year — which happens roughly one in four to one in five jobs — the float is gone, the contingency is gone, and you're negotiating change orders on a contract that didn't contemplate the exposure.
Overpriced schedules that lose the bid. The estimator adds a large contingency to cover themselves but can't justify the number. A competitor who did the analysis knows the risk is lower for certain phases and prices accordingly. You lose on price, not on capability.
The solution to both is the same: do the analysis by phase, document the assumptions, and price to a specific scenario rather than a feeling.
The Shift That Changes the Conversation
When you bring a weather analysis to a bid — actual historical workable day counts, P50/P80 ranges by phase, documented thresholds — the conversation with the owner changes. You're not defending a contingency number. You're presenting data.
- It positions your firm as the team that has actually thought through schedule risk
- It builds confidence in the estimate and speeds owner approval
- It gives you a defensible position when conditions materialize and a change discussion is needed
- It differentiates you from competitors adding a round number and hoping
Quantified risk is easier to price, easier to explain, and easier to recover against when it hits.
Know Your Weather Exposure Before You Carry the Risk
Xyloclime Pro analyzes 30 years of NOAA and ERA5 climate data for any U.S. project location, applies recency weighting, and outputs P10/P50/P90 workable-day scenarios by construction activity — ready to drop into your estimate.
Start Free 7-Day TrialNo charge for 7 days. Cancel anytime before day 8.