Weather analysis reduces uncertainty — it does not eliminate it. The goal is to quantify your exposure accurately, not to predict what next year's weather will be.
Most weather contingencies are still built on intuition, round percentages, or inherited assumptions. Ten percent because the last job needed it. Five percent because the owner pushed back. Eight percent because that's what the PM uses.
Every estimator who moves past that approach eventually faces the same question: which number do I actually use? The P50 looks defensible — it's the median, the most likely outcome. The P80 looks like padding — worse than four out of five historical years.
The answer isn't one or the other. It's understanding what each number is for — and using both to produce an estimate that can survive a hard negotiation and a bad weather year.
- P50 is the median — conditions in a typical year. It belongs in your base schedule.
- P80 represents conditions worse than roughly 80% of historical years. It belongs in your contingency calculation.
- The gap between P50 and P80 is your weather risk number — not a round-percentage guess.
- That gap varies dramatically by location, season, and activity type.
- High-variance markets reward careful analysis. Low-variance markets reward competitive pricing. Knowing which is which is the advantage.
- A 30-year average assumes the climate distribution is stationary. In many U.S. markets, recent patterns suggest it no longer is.
What These Numbers Actually Mean
Start with the definitions, because they get misused constantly.
P50 — the 50th percentile — is the median historical outcome for a specific location and project window. Half of all historical years produced better conditions than P50. Half produced worse. A schedule built to P50 is planned for a typical year.
P80 — the 80th percentile of bad conditions — represents a year where roughly 80% of historical years had better weather. One year in five, conditions at your project location and window will be worse than P80. Four in five, they won't.
P90 captures near-worst-case conditions — worse than roughly 90% of historical years. One in ten.
These aren't forecasts. They describe the historical distribution — what has happened, how often, and how bad. The chart below makes this concrete:
The contingency zone — the shaded region between P50 and P80 — represents the weather exposure that needs to be funded. A flat percentage contingency doesn't know where this zone sits or how wide it is.
Why P50 Alone Isn't Enough
Building a schedule and contingency against P50 means planning for conditions where half of all historical years produced worse outcomes. In practice, a schedule that fails to survive a P80 year will fail roughly once every five projects — which, across a project portfolio, is a predictable source of margin erosion.
A contingency sized to P50 isn't conservative. It's a coin flip on whether the weather cooperates.
The problem is that P50 feels correct. It's the average, the most common outcome, the year that looks like the historical record. Most estimators, when they pull data at all, are implicitly targeting something near P50.
What they're missing is the one-in-three or one-in-four year where conditions push meaningfully past the median. That's where contingencies disappear, schedules slip, and projects that looked sound at bid become losses at closeout.
Why P90 Is Too Conservative for the Base Bid
Price to P90 and you're pricing for conditions that occur roughly once in ten years. In eight of ten years, your weather contingency is substantially overbuilt — and your bid is uncompetitive against a contractor pricing to P80.
P90 belongs in the analysis — as a separately disclosed tail-risk reserve for catastrophic events. A direct hurricane hit, a Uri-level freeze, a hundred-year flood. These warrant separate treatment in the contract's force majeure language and a disclosed risk reserve, not an embedded premium in the base bid.
The Gap Is the Number
Here's the reframe that changes how to use these percentiles:
The gap between P50 and P80 is your weather contingency number.
P50 sets the base schedule — what the project looks like in a typical weather year. P80 sets the ceiling — what the project looks like in a moderately bad weather year that occurs roughly once in five. The delta between them is the float and contingency needed to absorb that variance without a loss.
This is fundamentally different from a percentage. A percentage contingency doesn't know whether your project is in a high-variance or low-variance climate, whether it's earthwork-heavy or interior-heavy, or whether it's running in the dry season or the wet season. The P50/P80 gap knows all of those things — because it's derived from the actual historical distribution for your specific location and project window.
The Gap Varies Dramatically by Location
This is where the analysis produces its most actionable insight — and the most competitive advantage. The P50/P80 gap is not the same everywhere. It varies by region, by season, and by market.
Ranges are illustrative estimates for a general 90-day exterior-heavy scope. Actual gaps depend on project window, activity type, and site-specific conditions. Recency-weighted analysis from NOAA and ERA5 data for the exact project location will produce a more precise figure.
The competitive implications run in both directions.
- In tight-variance markets: a quantified analysis lets you price more aggressively than a competitor using a flat percentage. You know the risk is lower. They're guessing it's higher.
- In wide-variance markets: the analysis tells you to price higher than gut feel suggests. Missing this is how projects turn into losses — not from catastrophic storms, but from a moderately bad year you didn't price for.
The Gap Also Varies by Phase
Within a single project, different phases carry very different P50/P80 gaps. Pooling all weather risk into a single project-level percentage means the high-risk phases are underprotected and the low-risk phases are overprotected.
Interior phases show near-zero P50/P80 gap — they're largely weather-neutral. Earthwork shows the widest gap by a significant margin, reflecting weather sensitivity, compound event exposure, and soil recovery lag.
Why a Flat Percentage Gets the Allocation Wrong
A flat 5% weather contingency applied across all phases doesn't know that earthwork needs 8× the weather protection that interior finish work does. The result: the phases that most need protection are consistently underfunded, and the phases that least need it carry excess contingency that should have been kept competitive.
Percentages shown are illustrative for a mid-Atlantic project with an earthwork-heavy scope. Actual phase contingency percentages derive from the P50/P80 workable-day gap for each specific phase window and location.
The Nashville Example
Consider a 150-day commercial site work and structure package in the Nashville area running March through July — a window that crosses through spring storm season into summer heat.
| Phase | Window | P50 Days | P80 Days | Gap | Contingency Exposure |
|---|---|---|---|---|---|
| Earthwork & Site Work | Mar–May | 68 | 57 | 11 days | $132k–$176k |
| Structural Steel | May–Jun | 72 | 68 | 4 days | $36k–$52k |
| Roofing & Enclosure | Jun–Jul | 61 | 55 | 6 days | $54k–$72k |
| Interior Rough-In | Jun–Jul | 88 | 86 | 2 days | $14k–$18k |
At a flat 5% weather contingency applied evenly, the earthwork phase — which carries 3× the variance exposure of any other phase — receives the same protection as interior rough-in. The P50/P80 phase analysis reallocates appropriately.
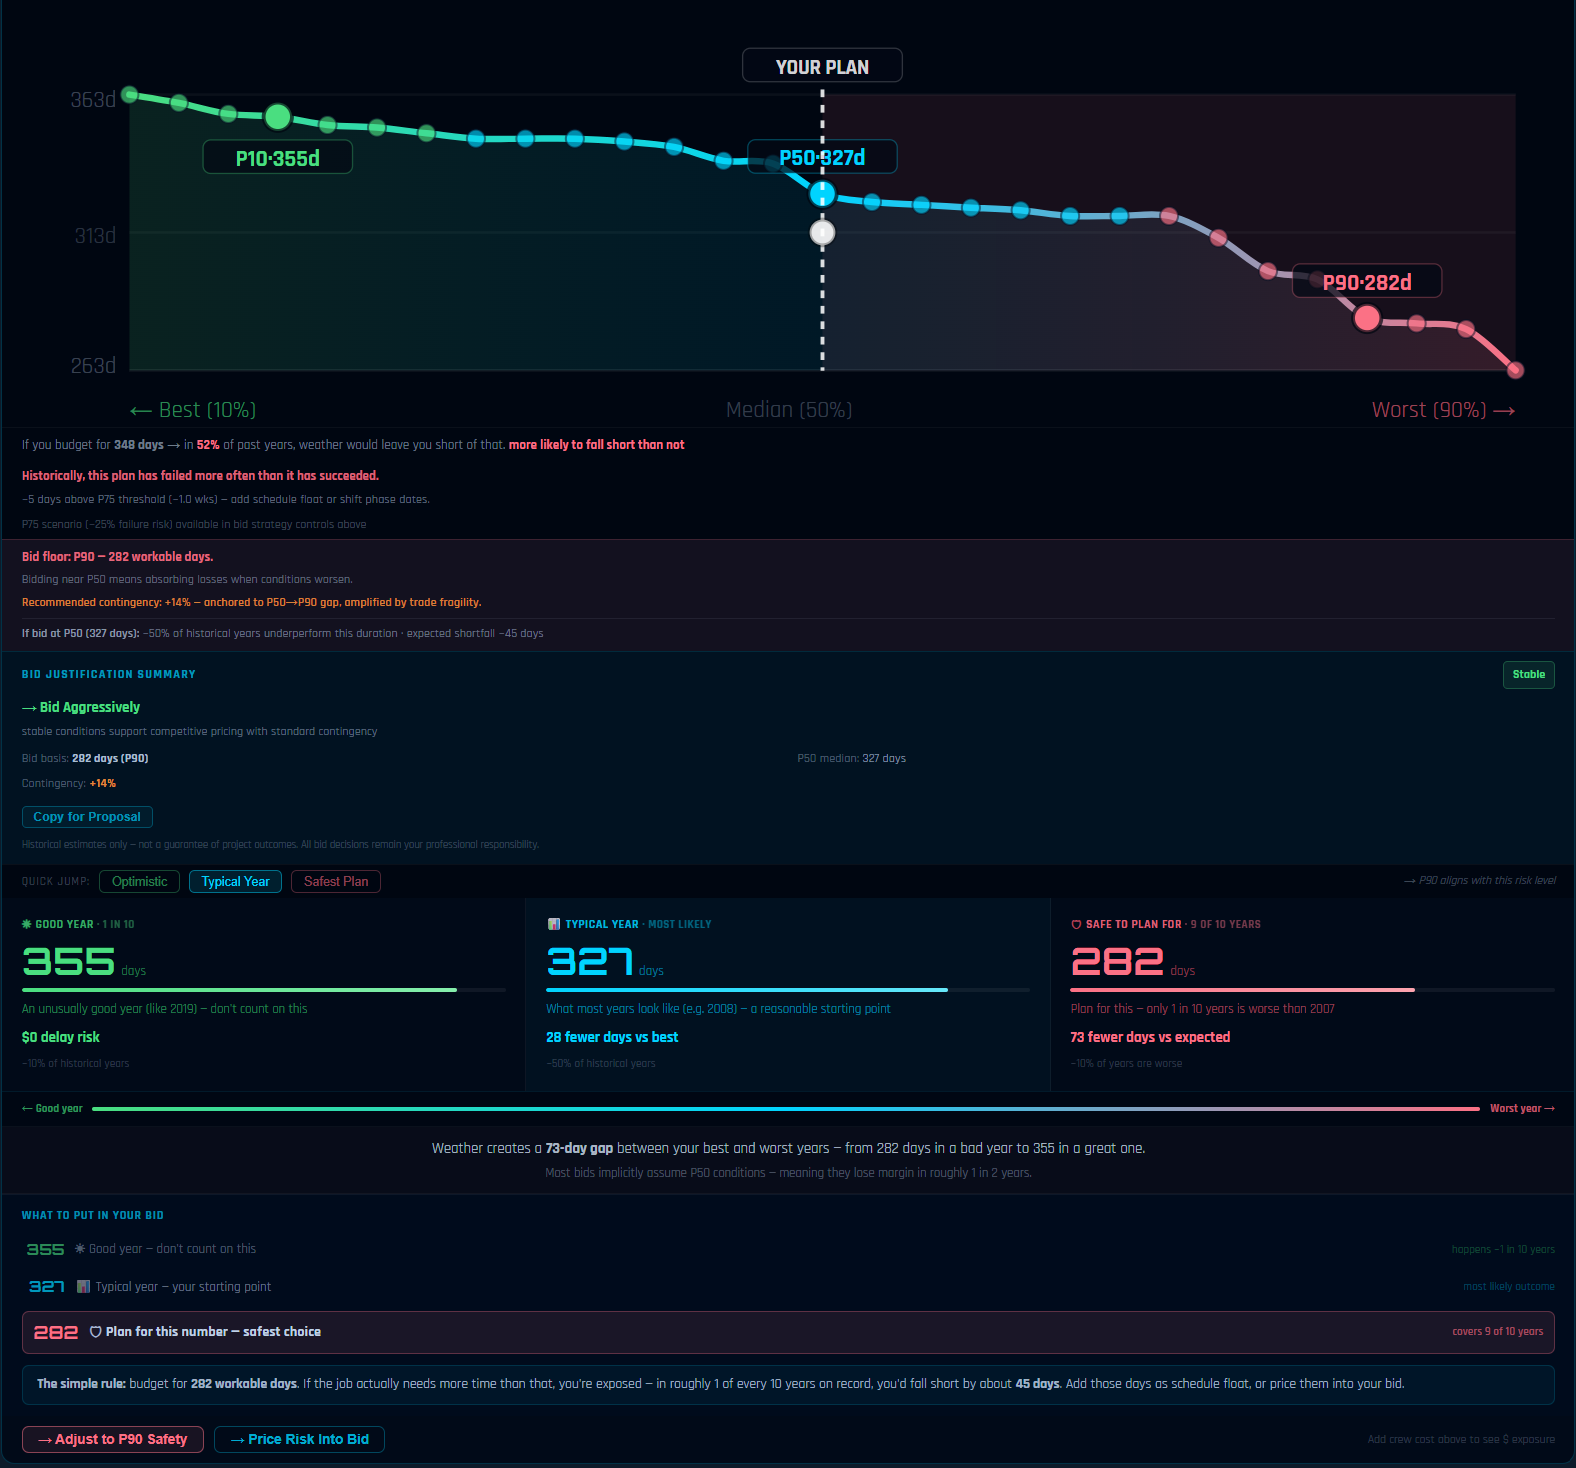
The P10/P50/P90 Distribution in Practice
Seeing the full range — from P10 (favorable year) to P50 (median) to P90 (near-worst-case) — makes the variance visible in a way that changes how preconstruction teams think about schedule risk.
The Climate Stationarity Problem
The practical implication: a recency-weighted P50/P80 gap is often wider than the gap produced by a simple 30-year average, particularly in markets where recent climate behavior has diverged from the long-term record. This affects both the contingency number and the competitive calculus around how aggressively to price.
How to Use Both Numbers
Many preconstruction teams find it useful to present both P50 and P80 to the owner as part of the bid documentation — not as two separate price points, but as a framework for explaining the weather risk picture:
- The base schedule is built on P50 — what a typical weather year looks like for this location and window.
- The contingency is sized to cover the P50/P80 gap — what it costs to survive a moderately bad weather year that occurs roughly one in five times.
- The P90 is disclosed separately as a tail risk — typically addressed through contract language rather than embedded in the base price.
This framing turns the weather contingency from a number you're defending into a number you're explaining. It demonstrates the analytical work. It gives the owner a framework for understanding what they're buying. And it differentiates your firm from every competitor who presented a round percentage with no underlying analysis.
Estimators have had access to weather records for decades. The challenge has always been turning those records into a defensible P50/P80 analysis — by location, by phase, by activity type, weighted to reflect current climate patterns rather than long-term averages that may no longer represent the conditions your project will actually encounter.
Know Your P50/P80 Gap Before You Set Your Contingency
Before you carry a flat percentage into your next bid — quantify the actual varianceXyloclime Pro generates P10/P50/P80/P90 workable-day scenarios for any U.S. project location, phase sequence, and schedule window — using 30 years of NOAA and ERA5 data with recency weighting applied.
Start Free 7-Day TrialNo charge for 7 days. Cancel anytime before day 8.