Weather analysis reduces uncertainty — it does not eliminate it. The goal is to quantify your exposure accurately, not to predict what next year's weather will be.
Texas is the largest construction market in the United States, and it has the most complex weather risk profile to match. Estimators working Texas projects face an exposure set that no other state replicates: summer heat that regularly stops outdoor work, a severe storm season that runs through spring and early summer, Gulf Coast hurricane exposure from June through November, and — as 2021 reminded the entire industry — catastrophic freeze events that nobody budgeted for.
Pricing weather risk in Texas with a flat contingency percentage doesn't work. The exposure is too variable, too location-dependent, and too concentrated in specific seasonal windows. An earthwork project in Houston carries a completely different risk profile than the same scope in Dallas, Lubbock, or El Paso — same state, different climate, different budget number.
Here's how to think through it.
The Four Weather Risks That Drive Texas Construction Exposure
Texas Is Not One Climate — It's Four
The biggest mistake estimators make on Texas jobs is treating the state as a single weather region. It isn't. Texas spans more climate zones than most countries, and the weather risk varies dramatically by geography.
Gulf Coast (Houston, Corpus Christi, Beaumont)
The Gulf Coast has the highest overall weather risk of any Texas region. High humidity amplifies heat index well beyond air temperature — a 95°F day with 80% humidity produces heat index readings above 110°F, triggering labor productivity loss and OSHA heat precautions even when the thermometer reading alone wouldn't. Gulf Coast projects also carry the most direct hurricane exposure. Historically, the Houston region has experienced recurring tropical impacts on a multi-year cycle, and indirect impacts — flooding rain from systems making landfall hundreds of miles away — happen more frequently. Budget accordingly for June through November.
North Central Texas (DFW, Waco, Abilene)
The DFW corridor is Texas's most active severe weather zone. The convergence of Gulf moisture and dry western air masses creates frequent supercell thunderstorm development in spring. Hail events are common and serious — large hail can damage roofing, exterior cladding, and equipment faster than any other weather event. Wind events during severe storms regularly exceed 60 mph, stopping crane operations and steel erection with little warning. The heat exposure is significant (Dallas averages 18 days above 100°F per year) but more manageable than the Gulf Coast or western regions.
West Texas and the Panhandle (Lubbock, Amarillo, Midland)
West Texas trades Gulf humidity for a different set of challenges. Summer temperatures regularly reach 105–110°F with low humidity — concrete performance is severely affected, requiring early morning pours, accelerated curing measures, and significant cold-water and ice use to hit mix temperatures. Wind is a chronic issue year-round: the Panhandle is one of the windiest regions in the lower 48, and sustained winds above crane operating limits are a regular occurrence, not an outlier event. Budget for more wind delays than any other Texas region.
South Texas (San Antonio, Laredo, McAllen)
South Texas has a long building season and mild winters, which sounds favorable — and it is, relative to northern states. The exposure concentrates in summer heat and the tail risk of drought-related soil conditions affecting earthwork. Late summer rainfall from Gulf moisture can also create significant site access problems, particularly on agricultural and infrastructure projects where unpaved access roads become impassable after heavy rain events.
Heat Thresholds: Where the Numbers Come From
Heat is the most consistently underpriced weather risk in Texas construction. Unlike rain or freeze — which are binary stop/go events — heat creates a gradient of productivity loss that is harder to see and easier to dismiss in an estimate.
| Heat Index | OSHA Risk Level | Construction Impact | Bid Risk |
|---|---|---|---|
| 91–103°F | Moderate | Mandatory rest breaks, hydration stops, pace reduction — 10–20% productivity loss on heavy outdoor work | Medium |
| 103–115°F | High | Shortened work hours, schedule shift to early AM, significant productivity loss — 25–40% on earthwork and site work | High |
| Above 115°F | Very High / Danger | Work stoppage for heavy outdoor labor. Concrete pours and steel placement effectively impossible without extraordinary measures | Severe |
The productivity loss in the "High" band is where the money goes. A Dallas earthwork project running June through August will have significant stretches where crews are working 5–6 hour days instead of 8–10, starting before sunrise and shutting down by midday. That's not a catastrophic event — it doesn't show up as a "shutdown day" in the weather record. But it's a real cost that belongs in the labor burden, and it compounds across every outdoor activity in the schedule.
In central Texas, a summer earthwork project that looks like 90 calendar days on paper may only deliver 55–65 full-productivity days. That gap is where margins disappear.
Hurricane and Gulf Season: How to Price the Tail Risk
Gulf Coast and south Texas projects need a separate hurricane/tropical weather line item, not just a general weather contingency. The math is different for tail-risk events.
A direct hurricane landfall on an active project site is a low-probability event for any specific location in any specific year — roughly 1–3% for coastal Texas sites. But the damage from that event, if it occurs, is not a few lost days. It's potential total loss of temporary structures, formwork, stored materials, and significant schedule setback. The P90 scenario for a Gulf Coast project should explicitly model what happens if a Category 1 or 2 system makes landfall within 50 miles of the site.
Indirect Gulf impacts — the tropical moisture bands that drive 10–20 inches of rain in 48 hours — are much more frequent and still cause multi-day shutdowns. Houston receives 3–4 significant rainfall events per year that flood job site access roads and halt work regardless of direct storm track. These belong in the base case workable-day count, not in an extraordinary events reserve.
Winter Storm Uri: Pricing the Freeze That Shouldn't Happen
In February 2021, Texas experienced a week-long freeze that shut down essentially all construction activity statewide. Temperatures dropped to single digits across most of the state. Water lines burst in buildings under construction, concrete was ruined, formwork failed, and supply chains — unprepared for cold-weather demand — collapsed. Projects lost weeks of schedule.
The standard response from estimators who weathered Uri: "That was a once-in-a-generation event. We can't price for that every time."
That's partly true and partly dangerous. Uri-level events are rare — 30 years of NOAA data for most Texas locations shows only a handful of significant freeze events. But rare is not zero, and the cost when it happens is severe enough that it should show up in your P90 scenario. The right approach isn't to price a full Uri contingency into every Texas bid. It's to acknowledge the risk in your P90 modeling, document the assumption explicitly, and structure your contract's force majeure language to cover it.
For concrete-heavy scopes running December through February in Texas, cold-weather concrete provisions should be in the estimate regardless of year. The mild-winter assumption is tempting but fragile.
Severe Storm Season: The Spring Window That Estimators Ignore
March through June is the most dangerous months for active Texas construction from a severe weather standpoint — not summer, not hurricane season. This is peak tornado and hail season, with systems developing rapidly and giving limited warning time.
The weather risk this creates is different from heat or rain. It's not gradual — it's event-driven. A severe thunderstorm with embedded tornado warning shuts down crane operations, clears workers from elevated steel, and may cause physical damage to the work in place. Historically, DFW and central Texas projects running March through June see multiple significant severe weather disruption events per season, plus a reserve for events that cause actual damage versus just delay.
This is also the window where hail causes real damage to work in place. Roofing, exterior insulation, glazing, and stored materials on open sites are all exposed. One large hail event can set a roofing or exterior envelope scope back by weeks and create significant insurance claim complexity.
Building a Texas Weather Risk Model: The Right Framework
Given all four risk categories — heat, severe storms, Gulf season, and freeze — a Texas weather risk model needs to do more than count rain days. Here's the framework that actually works:
-
Define your risk window by phase, not by project A Texas project running August through the following April passes through four distinct weather risk windows: summer heat (Aug–Sept), mild fall (Oct–Nov), freeze risk (Dec–Feb), and severe storm season (Mar–Apr). Each phase needs its own workable-day analysis against activity-specific thresholds — not a single project-wide number.
-
Run location-specific NOAA data, not state averages Houston and Lubbock are both in Texas. Their 30-year weather records look almost nothing alike. Always pull from the nearest NOAA station to your actual site — ideally within 15 miles. State-level or regional averages are useless for bid-quality analysis.
-
Apply recency weighting to your historical data Texas climate has shifted measurably over the last 30 years — summers are hotter, extreme rainfall events are more frequent, and the Gulf season is more active. A 30-year simple average underweights the last five years, which are your most predictive data. A practical approach is exponential recency weighting, where more recent years carry higher weight in the analysis — so a wet summer from 2023 matters more to your model than a wet summer from 2003.
-
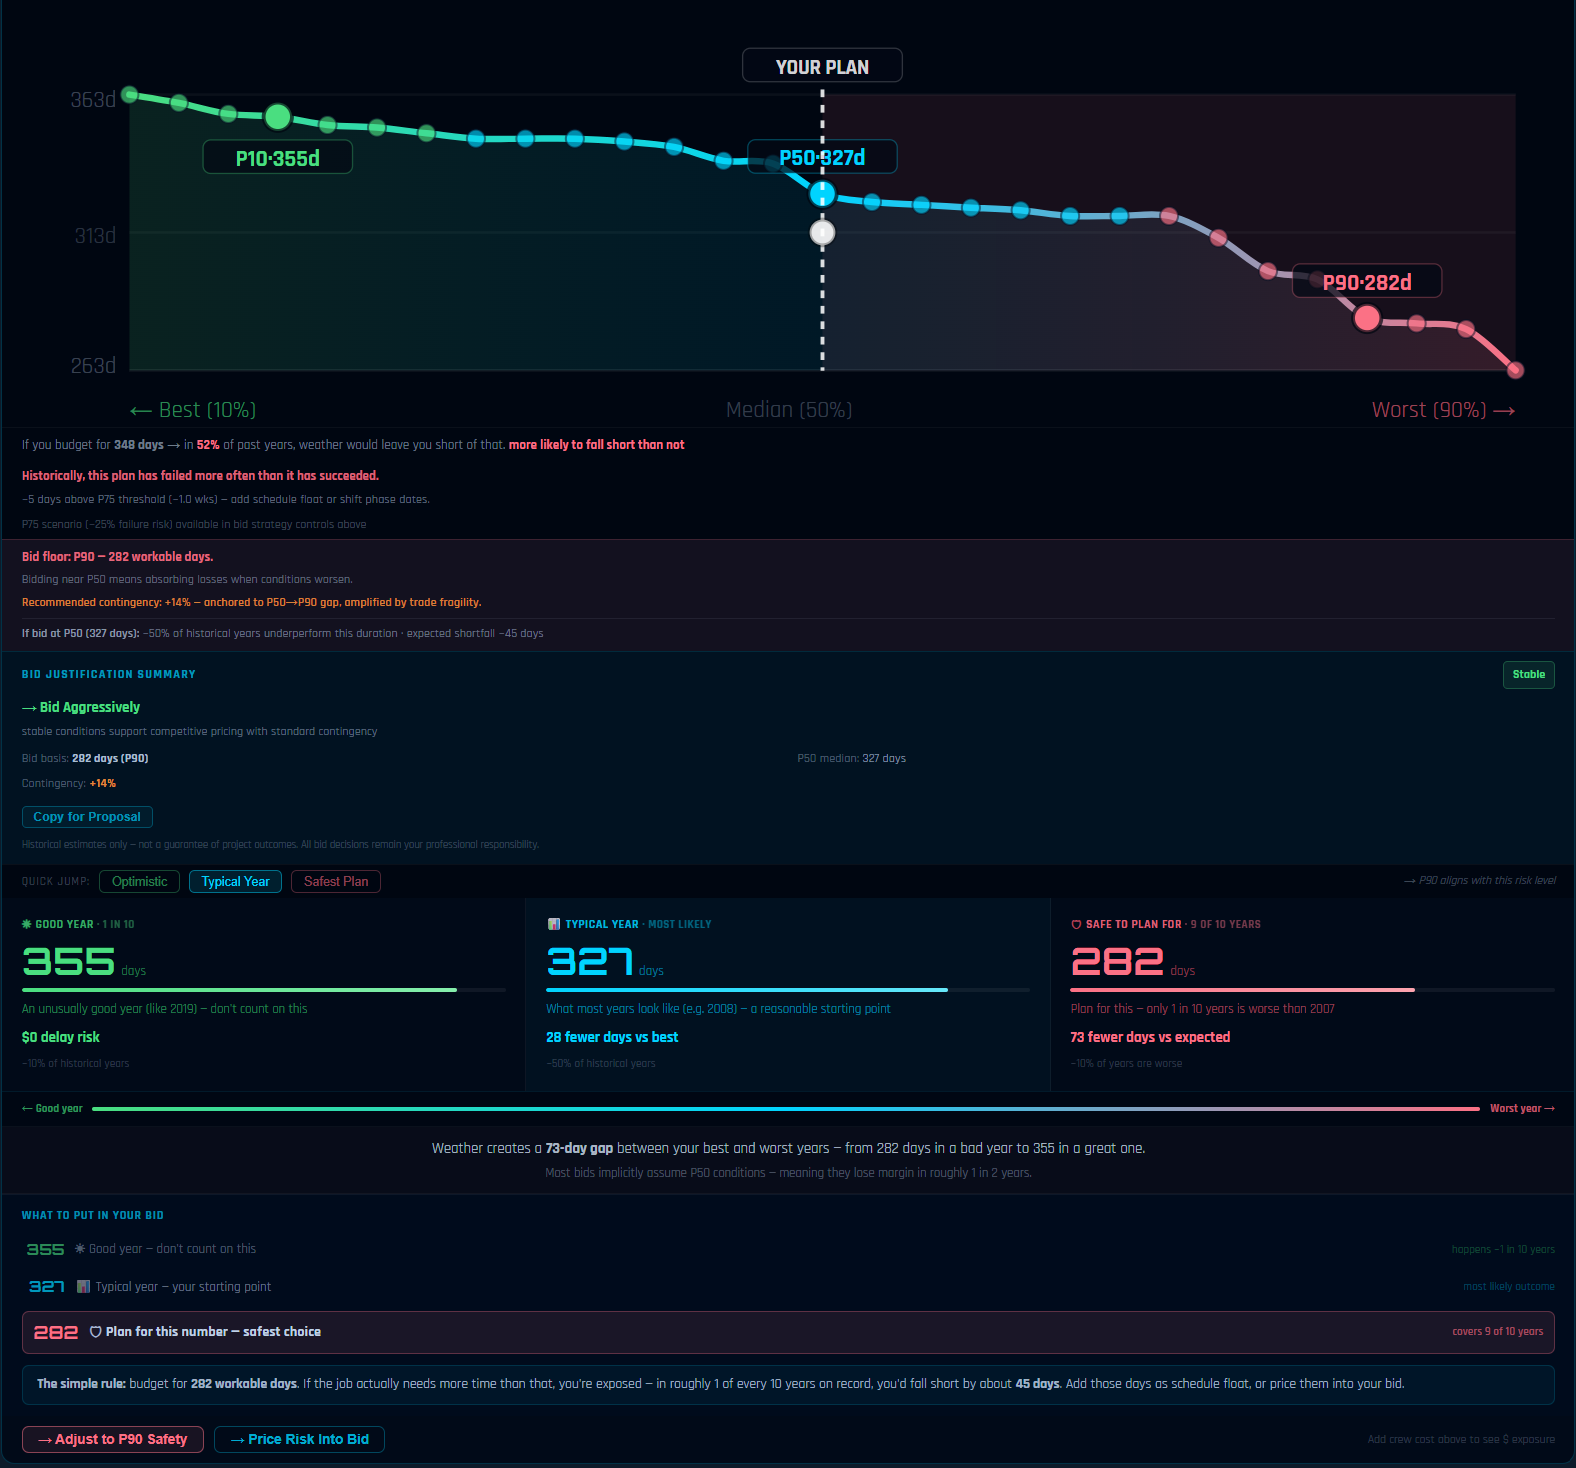
Evaluate P50 and P80 scenarios — and define what each covers P50 is the median — conditions you'd expect in a typical Texas year. P80 represents conditions worse than 80% of historical years, roughly one-in-five. Many contractors find it useful to evaluate both scenarios when determining contingency and schedule strategy: P50 anchors the base case, P80 frames the contingency range. The P90 — which captures tail events like Uri or a direct hurricane hit — is typically kept as a separately disclosed risk reserve rather than embedded in the base bid.
-
Separate heat productivity loss from shutdown days This is the most Texas-specific adjustment in the model. Shutdown days — days with rain above threshold, freeze, or severe storm warnings — are binary and show up clearly in weather records. Heat productivity loss is gradual and doesn't appear as a "shutdown" even when it's costing you 30% of crew output. It needs to be modeled separately as a labor productivity factor, particularly for earthwork and site work phases running June through September.
A 240-day site work and underground utilities package in the Houston metro, running April through November. Simple 30-year average approach: 31 non-workable days for rain and extreme heat combined.
Recency-weighted P50 analysis: 38 non-workable days — reflecting recent Gulf moisture trends that have increased heavy rainfall frequency.
Recency-weighted P80 analysis: 52 non-workable days — including a modeled indirect tropical moisture event in August and an extended summer heat productivity window.
The gap between the simple average and the recency-weighted P80: 21 additional exposure days. At $15,000–$20,000 per day in crew and equipment costs, that's $315,000–$420,000 in unpriced exposure on a single scope.
Xyloclime Pro combines NOAA station observations with ERA5 reanalysis datasets to improve spatial coverage consistency across Texas project locations — particularly useful in areas where ground station density is lower or station records have gaps.
Texas Weather Risk by Month — At a Glance
Risk doesn't distribute evenly across the calendar. Here's how the four exposure types stack up month by month across Texas regions:
| Month | 🌡 Heat | ⛈ Storms | 🌀 Gulf / Rain | ❄ Freeze | Overall |
|---|---|---|---|---|---|
| January | — | Low | Low | High | Moderate — freeze risk |
| February | — | Low | Low | High | Moderate — freeze tail |
| March | — | High | Med | Low | High — storm season opens |
| April | — | Peak | Med | — | Peak — tornado/hail season |
| May | Low | Peak | Med | — | Peak — busiest storm month |
| June | High | Med | High | — | High — heat + Gulf season starts |
| July | Peak | Low | Med | — | High — peak heat exposure |
| August | Peak | Low | High | — | Peak — heat + tropical activity |
| September | High | Low | Peak | — | High — peak Gulf season |
| October | Low | Low | Med | — | Low — best building window |
| November | — | Low | Low | Low | Low — favorable conditions |
| December | — | Low | Low | Med | Low — freeze exposure building |
Risk levels are generalized statewide composites. Coastal Texas has higher Gulf/rain exposure year-round; West Texas has higher wind exposure; North Texas has higher freeze exposure in winter months.
What This Means for Your Texas Bids
A few practical conclusions for estimators pricing Texas work:
Gulf Coast projects need a hurricane/tropical weather line item, not just a weather contingency. Combine a standard workable-day analysis with a separate probabilistic reserve for tropical system impacts. The two risks have different shapes and shouldn't be pooled into one number.
DFW and central Texas projects running March through June need explicit severe storm float. 4–8 days of severe weather disruption reserve is not conservative — it's calibrated to historical frequency. Budget it as float, not contingency, so it shows up in the schedule as well as the cost.
West Texas wind is chronic, not exceptional. If you're running crane picks or steel erection in the Panhandle, wind-day counts from a 30-year NOAA record will tell you exactly how many days per month your crane will be grounded. That's not a risk to reserve against — it's a quantity to schedule around.
Summer heat belongs in labor productivity, not just workable-day counts. An earthwork crew working 6-hour days in July isn't generating a weather-shutdown event — but they're generating 25–40% less output per calendar day than your schedule assumes. Price that into the labor burden, especially for scopes running June through September in central and west Texas.
The freeze tail is real. One significant freeze event per decade is historically accurate for most Texas locations. Make sure your force majeure language covers it, and for concrete-heavy scopes in winter, include cold-weather provisions even in Texas.
Texas weather risk is not one problem — it's four overlapping problems that peak in different seasons, affect different activities differently, and vary significantly by geographic sub-region. A flat contingency percentage applied to the full project scope will either underprice the real risks or overprice the low-risk phases and cost you the bid. Phase-level analysis is the only approach that works.
The Bottom Line for Texas Estimators
Texas is not a hard state to build in year-round — it has real advantages over northern markets, particularly the mild winter that allows continuous work on most scopes from November through February. But those advantages come with tradeoffs: a brutal summer, an active severe storm season, Gulf exposure, and a freeze tail that modern Texas infrastructure was not designed to absorb.
Estimators who price these risks accurately — by location, by phase, by season — will find themselves with contingencies they can defend, schedules that hold, and a clear advantage over competitors who are still adding a round number and hoping the weather cooperates.
The underlying weather data has existed for decades. The challenge has always been turning it into something estimators can actually use — by location, by phase, by activity type, weighted to reflect current climate behavior rather than long-term averages that may no longer represent what the next three years of Texas weather will look like.
Know Your Texas Exposure Before You Carry the Risk
Bid with quantified weather risk instead of contingency guessworkXyloclime Pro analyzes 30 years of NOAA and ERA5 data for any Texas project location, applies recency weighting, and outputs P10/P50/P90 workable-day scenarios by construction activity — broken out by heat, rain, wind, freeze, and Gulf exposure.
Start Free 7-Day TrialNo charge for 7 days. Cancel anytime before day 8.